Discover how to quickly understand each data product cost
If you use Snowflake in production and your monthly bill keeps growing, you probably know the feeling: the total number is high, finance asks questions, and the only answer you can give is “we processed more data”. That answer is useless. “More data” is not a cost driver. A pipeline is. A team is. A badly designed model is. A forgotten full refresh is. The problem is not that Snowflake is expensive. The problem is that for most teams Snowflake costs are a black box with zero attribution.
This article focuses specifically on production-grade cost attribution using Snowflake + dbt + Airflow, showing how to separate compute, tag workloads, and track costs per model, pipeline, and team.

Total cost is useless. You need cost per data product.
Most organizations monitor Snowflake like this: credits per day, credits per warehouse, maybe some alerts when usage spikes. That’s a good start for capacity planning, but it does nothing for accountability or optimization. Knowing that WH_TRANSFORM used 2,000 credits yesterday doesn’t tell you which model caused it or which team owns it.
What you actually need is cost sliced by the same boundaries you use to design your platform. If you think in terms of domains, marts, or pipelines, your cost model should match that. Practically, you want to be able to answer questions like:
- How much does the “finance mart” cost per month?
- Which dbt models are the most expensive?
- Which Airflow DAG burns the most credits?
- How much does each team consume compared to their budget?
- What changed between last month and this month?
These are unit economics for your warehouse. Once you have them, cost optimization becomes a normal engineering task: refactor expensive models, change materializations, resize warehouses. Without them, you’re operating blindly.
Granular tagging in dbt (QUERY_TAG as metadata layer)
Snowflake has a built-in feature that solves 80% of the problem: QUERY_TAG. Every query can carry metadata. The mistake most teams make is leaving it empty or setting a static value like “dbt”. That gives you nothing.
You want every dbt model execution to automatically include structured metadata such as:
- model name
- schema or layer (staging/intermediate/marts)
- environment (dev/stage/prod)
- optionally domain or team
This should not rely on developers remembering to add config. It must be automatic and centralized.
Example macro:
-- macros/query_tag.sql
{% macro build_query_tag(functionality = "default") %}
    {% set tag = {
        "model": this.name,
        "schema": this.schema,
        "env": target.name,
        "functionality": functionality
    } %}
    {{ return(tag | tojson) }}
{% endmacro %}
Apply it to specific domains:
# dbt_project.yml
models:
  +query_tag: "{{ build_query_tag() }}"

  staging:
    +query_tag: "{{ build_query_tag('staging') }}"
  reporting:
    +query_tag: "{{ build_query_tag('reporting') }}"
Need even more flexibility? No problem, you can query_tag in {{ config }} macro on top of the model file, or make a mapping to set functionality based on model’s “tag”. Sky is the limit!
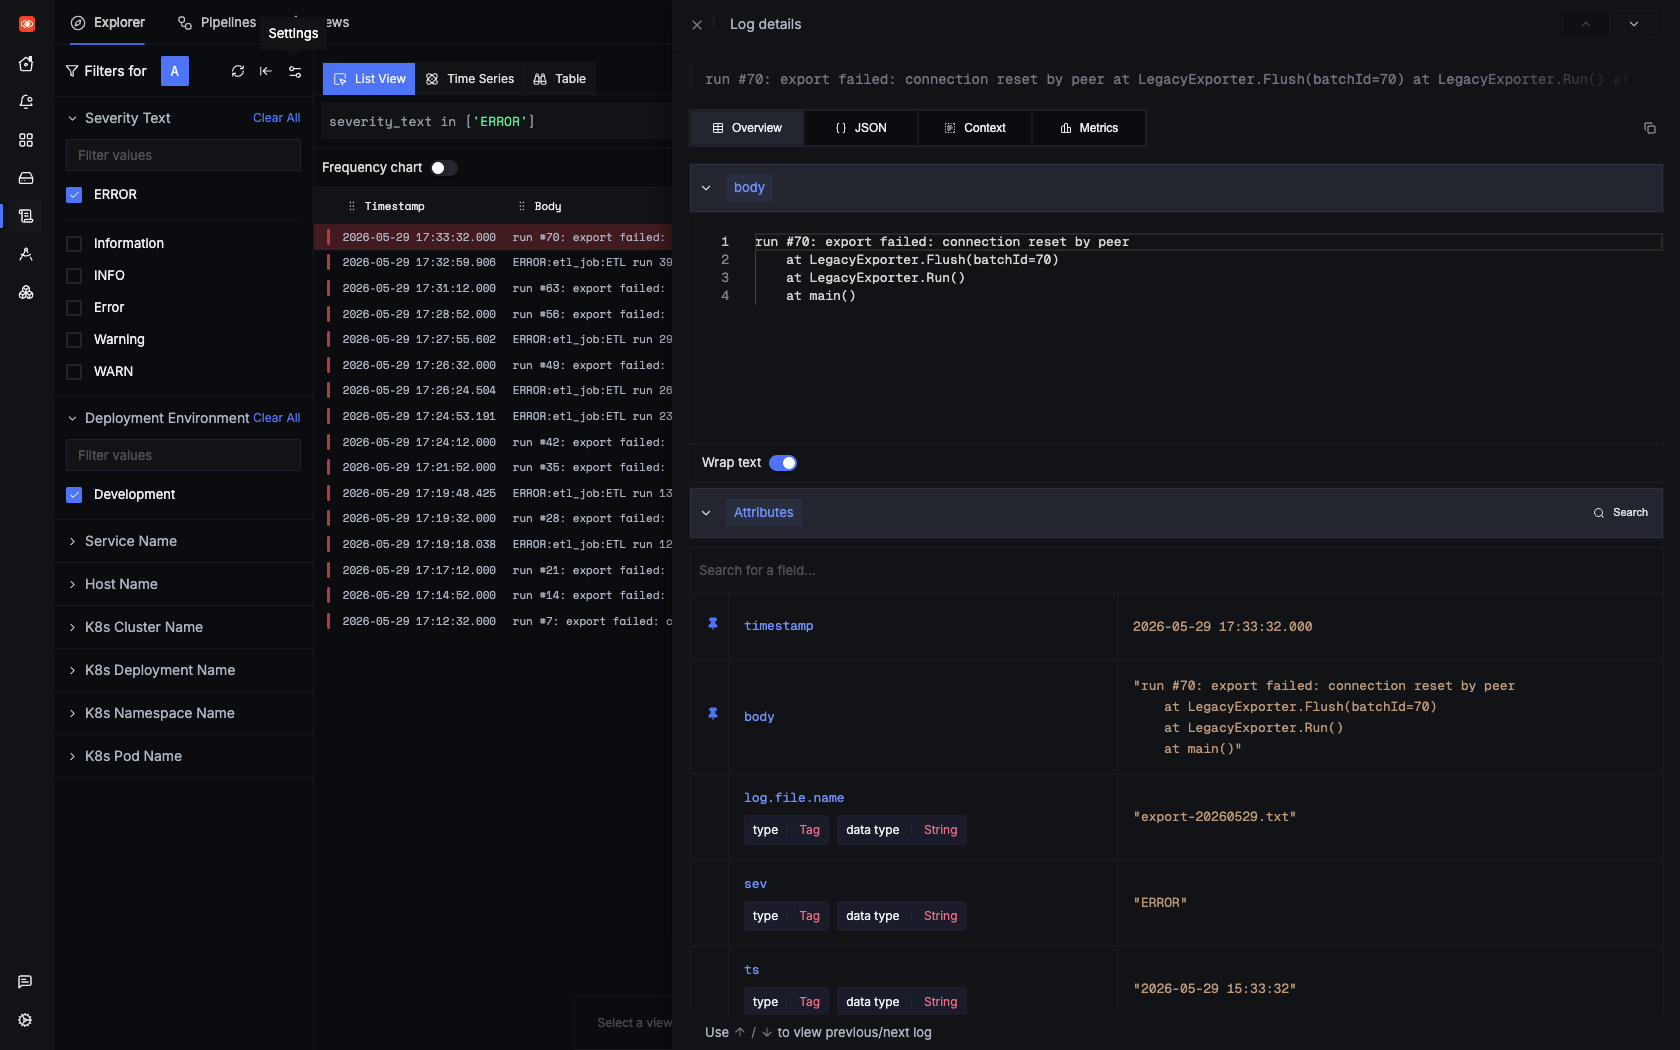
From this point forward, every dbt-generated query writes structured JSON into QUERY_TAG. In SNOWFLAKE.ACCOUNT_USAGE.QUERY_HISTORY, you can now parse these tags and group costs by model, layer, or environment. This effectively turns Snowflake’s query history into a metadata-rich event stream you can analyze like any other dataset.
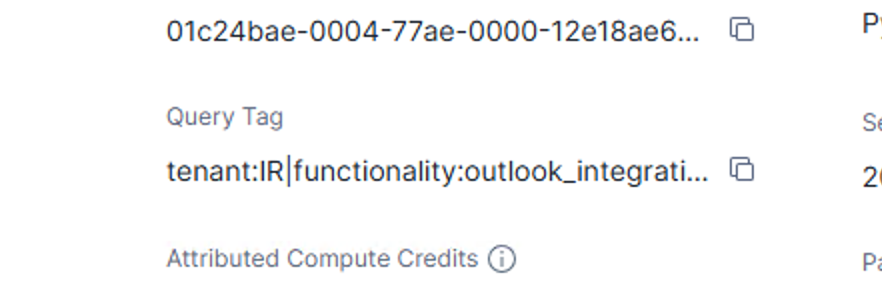
Without this step, attribution at the model level is almost impossible. With it, you get per-model receipts.
Tagging outside dbt (Airflow / orchestration layer)
dbt is only part of your workload. Most stacks also have ingestion jobs, backfills, Python scripts, feature engineering tasks, and ad-hoc SQL. If you only tag dbt, you’re still blind to a large portion of spend.
The same principle applies: every session should set a meaningful QUERY_TAG.
In Airflow, you can set session parameters before running queries (if you are using official Snowflake SDK):
session_parameters={
    "QUERY_TAG": '{"pipeline":"daily_ingestion","team":"data-platform"}'
}
Or explicitly:
cursor.execute("""
ALTER SESSION SET QUERY_TAG = '{"pipeline":"daily_ingestion","team":"data-platform"}'
""")
The goal is consistency. Every job should declare ownership. At minimum, include pipeline and team. Once this is enforced, every credit consumed by Snowflake has context attached. Nothing runs anonymously.
This is what allows you to later say “this specific DAG costs $900/month” instead of “something in ingestion is expensive”.
Warehouse strategy (compute isolation)
Tagging gives you logical separation. Warehouses give you physical separation. You need both.
Running everything on a single warehouse destroys visibility. All queries share the same compute pool, so spikes overlap and attribution gets messy. It also prevents independent scaling and tuning.
A better approach is to split warehouses along meaningful boundaries. Two common patterns work well.
Workload-based:
- loading / ingestion
- transformation (dbt)
- reporting / BI
- ad-hoc / notebooks
Team/domain-based:
- marketing
- finance
- product
- data science
Start simple. Even separating loading and transforming usually provides a big clarity win. Once isolated, you can answer high-level questions immediately, such as whether transformations or ingestion drive most costs, and you can resize or schedule warehouses independently.
Warehouse isolation also improves governance. When a team knows “this is our warehouse and our bill”, behavior changes quickly. Ownership creates optimization.
Reporting using ACCOUNT_USAGE
Once you have tags and isolated compute, all that remains is aggregation. Snowflake already exposes everything you need in system views.
Key sources:
- QUERY_HISTORY — query execution details and tags
- WAREHOUSE_METERING_HISTORY — credits consumed per warehouse and time window
The approach is straightforward: allocate warehouse credits to queries proportionally and aggregate by your tags.
Simplified example:
with queries as (
    select
        query_id,
        warehouse_name,
        start_time,
        total_elapsed_time,
        parse_json(query_tag) as tag
    from snowflake.account_usage.query_history
),

warehouse_usage as (
    select
        warehouse_name,
        start_time,
        credits_used
    from snowflake.account_usage.warehouse_metering_history
)

select
    tag:model::string as model,
    tag:env::string as env,
    sum(credits_used) as credits
from queries
join warehouse_usage
  using (warehouse_name)
group by 1,2;
In practice you’ll refine allocation logic to handle overlapping queries, but the principle remains: cost becomes just another fact table. You can materialize marts like:
- cost_per_model
- cost_per_pipeline
- cost_per_team
- daily_cost_trend
At that point, cost analysis is just SQL and dashboards. No guesswork.
Final thoughts
Snowflake cost attribution is not a tool problem. It’s a design problem. If you design for shared compute and no metadata, you get zero visibility. If you design for tagging, isolation, and structured aggregation, cost becomes measurable and manageable.
The implementation is simple: tag everything, isolate compute, and build one cost mart. After that, you’re no longer explaining bills to finance. You’re showing them exactly which data product generated them.
Joachim Hodana - Software & Data Engineer
No idea where your Data Warehouse spend goes? was originally published in Lortech Solutions Blog on Medium, where people are continuing the conversation by highlighting and responding to this story.